Multi-step time series forecasting using Long short-term memory
Intro
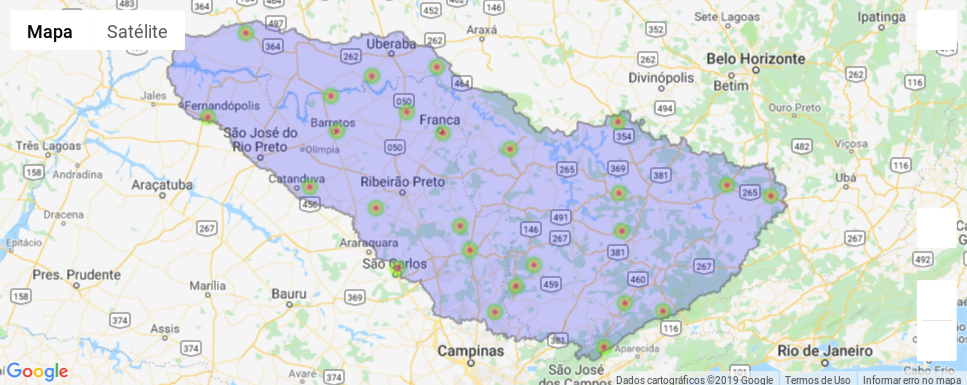
Figure 1. Region of interest with rain gauges highlighted
Exploratory data analysis (EDA)

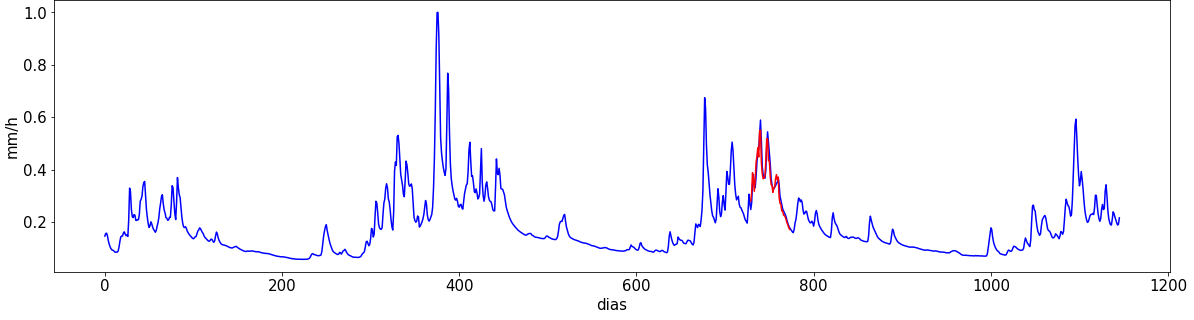
Figure 2. Seasonal hydraulic flow
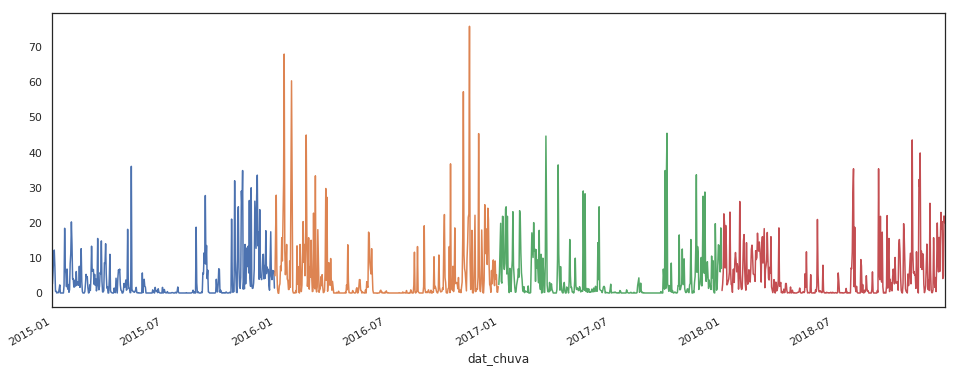
Figure 3. Seasonal rains within the region of interest
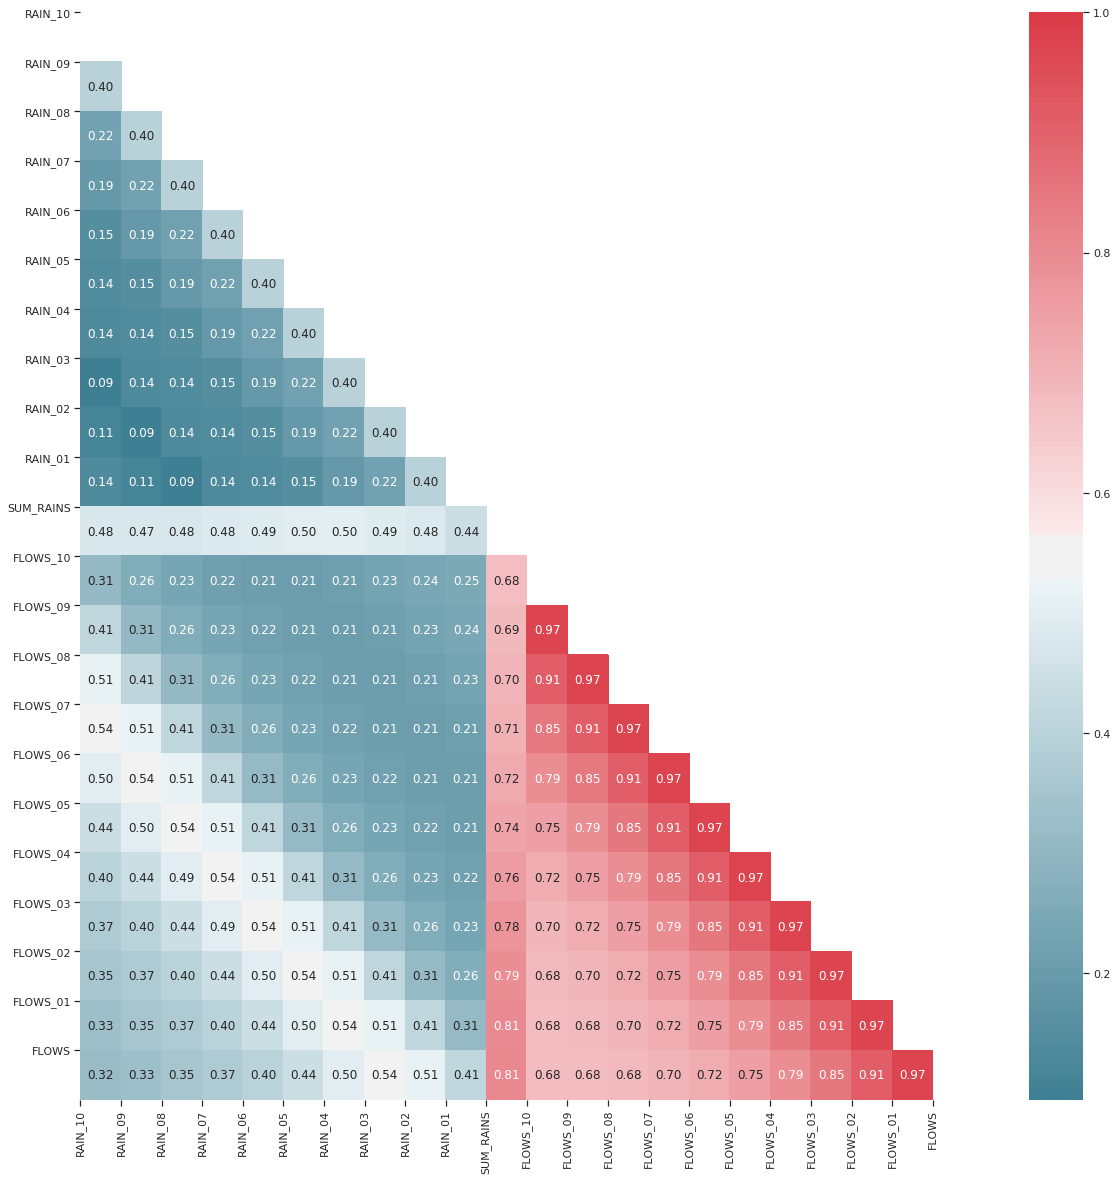
Figure 4. Correlation matrix of the lagged variables